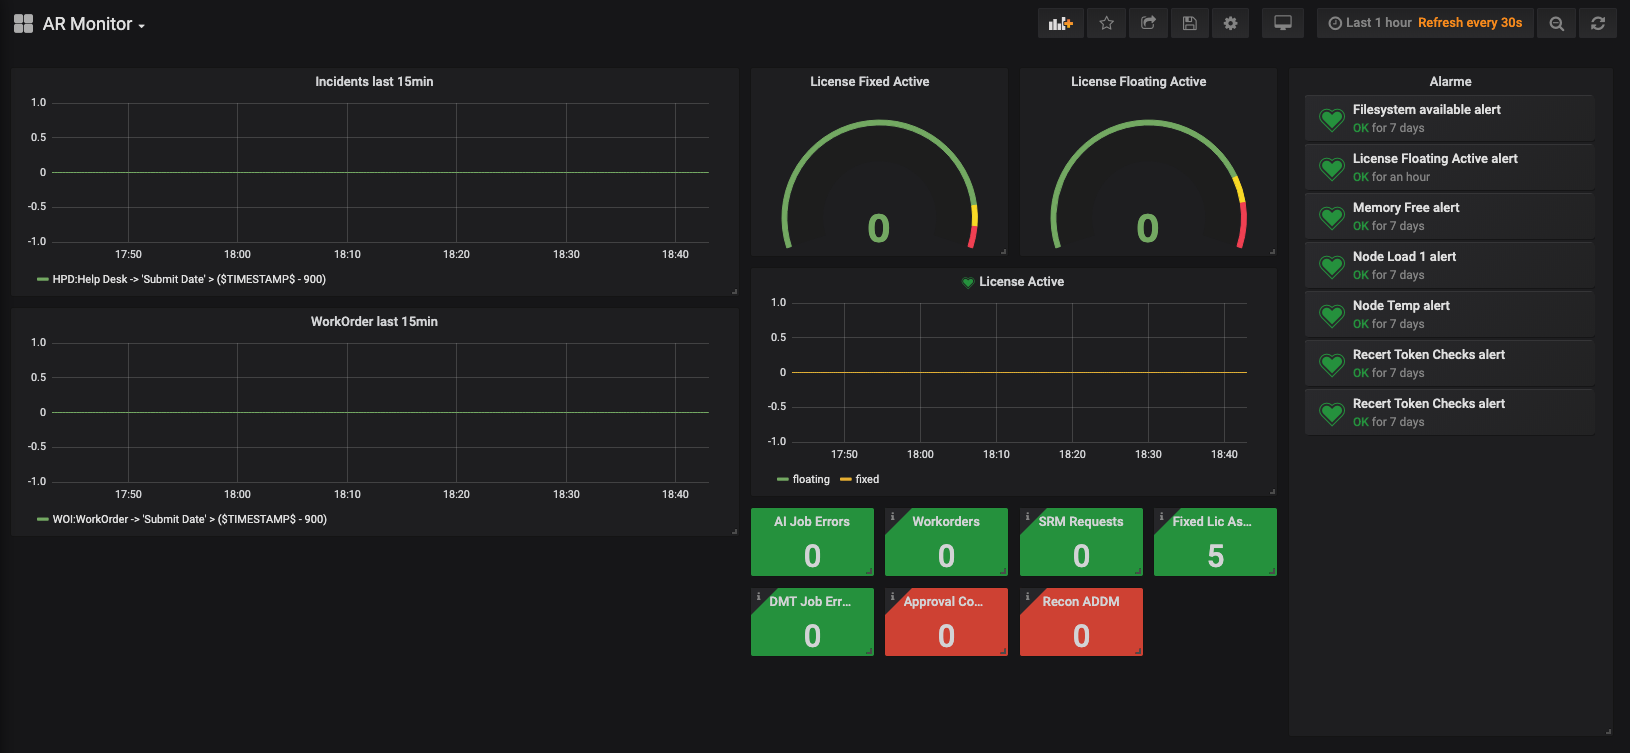
Our AR Monitor enables you to create fine grained Monitors for your BMC Remedy, SmartIT and MyIT Applications. The data is provided as prometheus compatible metrics for state-of-the-art analytics and visualisation.
Table of Content
Introduction
AR Monitor allows you to query data from AR System Servers. The data is then exposed via prometheus compatible metrics.
New to AR Monitor? Getting started
Configuration parameters
Configuration
The following Environment Variables can be used to change the behaviour of the Monitor API.
| parameter | sample | description | default |
|---|---|---|---|
| BASEURL | http://localhost:8080 | Base URL of the used arrestfulapi | |
| AR_SERVER | pier1 | Remedy Server to connect to | |
| AR_PORT | 1234 | Remedy Server TCP Port | |
| AR_USER | Demi | Remedy Admin User who is used for all queries | |
| AR_PASSWORD | <ar-password> | Remedy Admin User password | |
| MONITOR_USERNAME | monitor | Username to access the monitor API. Preferred name; USERNAME still works as fallback. USERNAME is also set by some operating systems (e.g. Windows), which is why the new name exists. |
|
| MONITOR_PASSWORD | <api-password> | Password to access the monitor API. Preferred name; PASSWORD still works as fallback. |
|
| INTERVAL | 30 | Default Interval in seconds in which each metric is checked. Can be overwritten per metric. | 30 |
Container image, health and readiness
The Docker image is based on Node 24 (node:24-bookworm-slim) and runs as uid/gid 999; the configuration is stored in /home/node/app/conf. GET /health (liveness: the process answers) and GET /ready (readiness: the scheduler runs and conf/metrics.json is readable; it does not depend on Remedy) need no authentication. Use /health for liveness and /ready for readiness probes.
Import your metrics into prometheus
You can use Prometheus to pull your metric values regularly and to store the values in its time-series database.
1
2
3
4
5
6
7
8
9
10
11
12
13
  - job_name: Armonitor
    scrape_interval: 5s
    scrape_timeout: 5s
    metrics_path: /prometheus/metrics
    scheme: https
    basic_auth:
      username: monitor
      password: <api-password>
    static_configs:
    - targets:
      - your.armonitor.url
      labels:
        app: Armonitor
Build Dashboards with Grafana
Once you have your metrics available in prometheus you can use Grafana to build beautiful dashboards.